Easily Explore Your Log Data with a Single Query in InsightIDR

We are delighted to announce that Log Search now supports grouping by multiple fields in your log data. By running a single query, you can easily drill down into your log data for in-depth analysis, while still getting an overall view of your data.
Read on to find out how to get this rich insight into your log data, without exporting data to a BI tool or opening multiple browser windows.
How to use LEQL Multi-groupby
Let’s start with a common example of a “groupby” query: viewing login attempts per user. This log data is available in the “Asset Authentications” log set in Log Search.
groupby(destination_user) calculate(count)
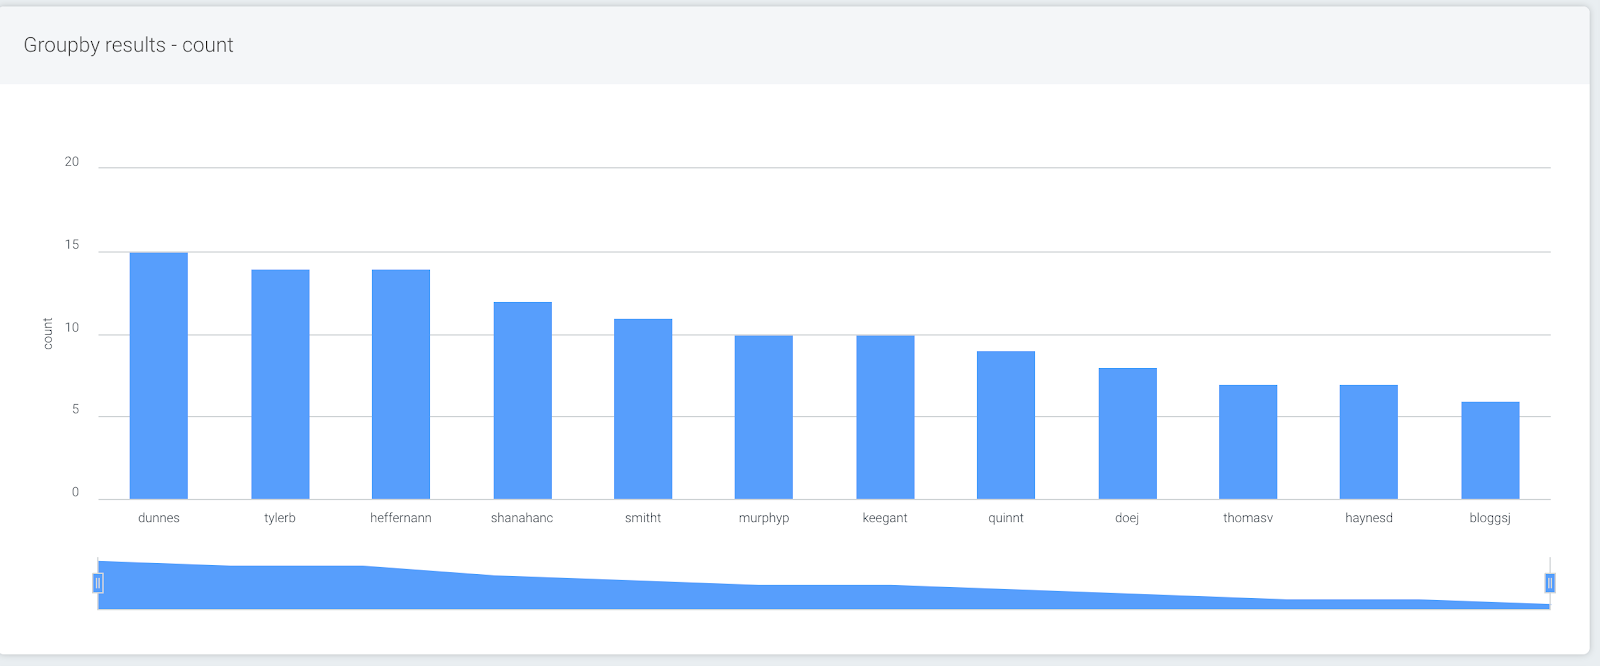
This query will show the users with the highest number of login attempts. But you probably want to see a bit more context—were these login attempts all from the same device or country code? What was the result of these attempts?
By adding additional fields, this level of drill-down is now possible without needing to run multiple queries in different tabs. Simply add up to five fields in a single groupby query to get extra insights.
Using the example above, let’s expand the query so more information about the login attempts can be easily viewed. You can do this by typing additional keys in the “Advanced” querybuilder mode, or you can use the buttons provided in “Simple” mode.
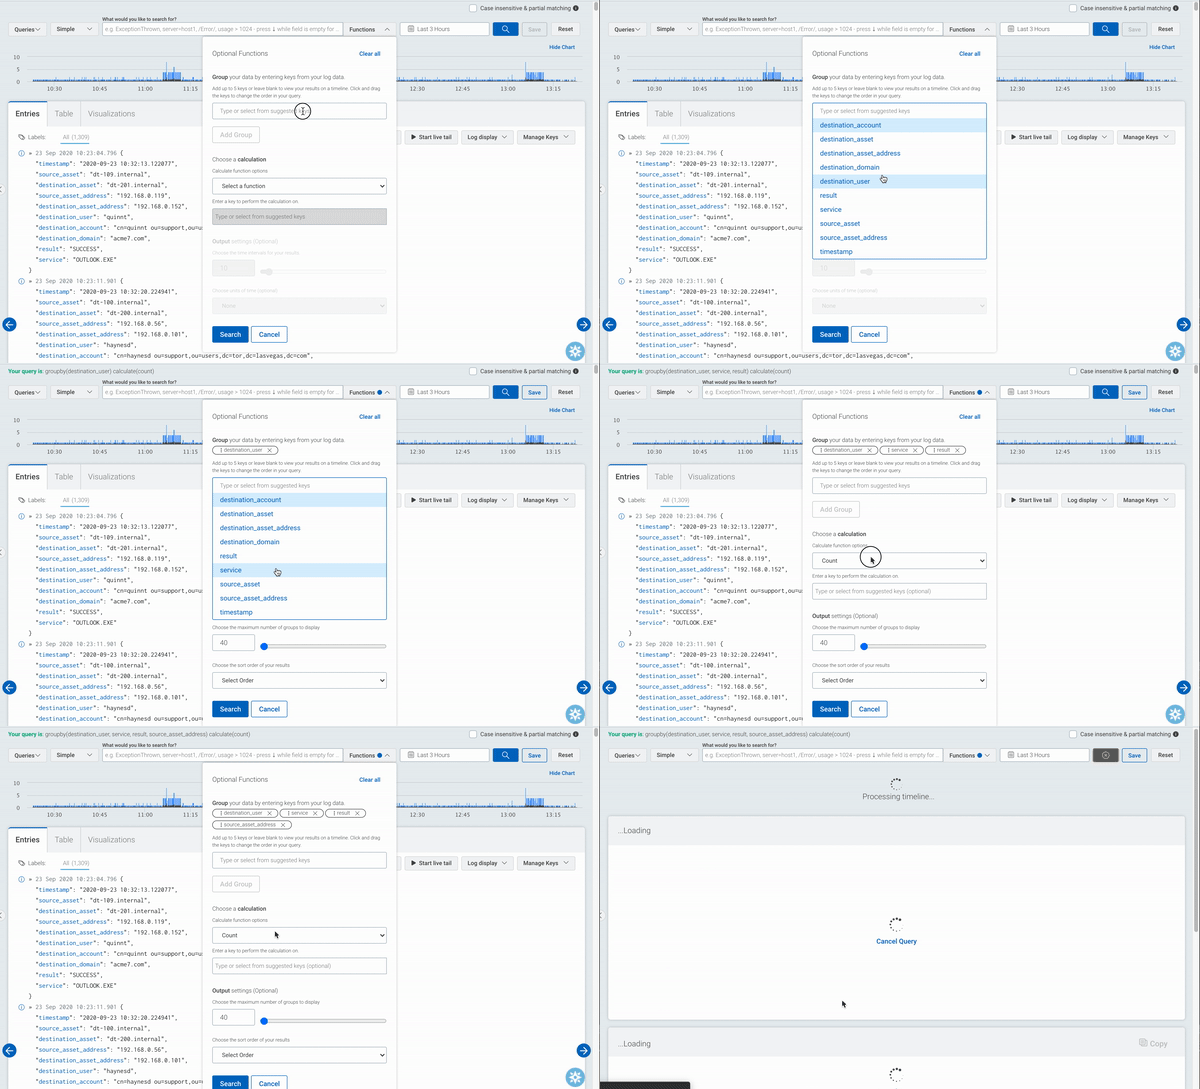
This query will add the following information about the login attempts: result, the service, and the IP address of the asset.
groupby(destination_user, result, service, source_asset_address) calculate(count)
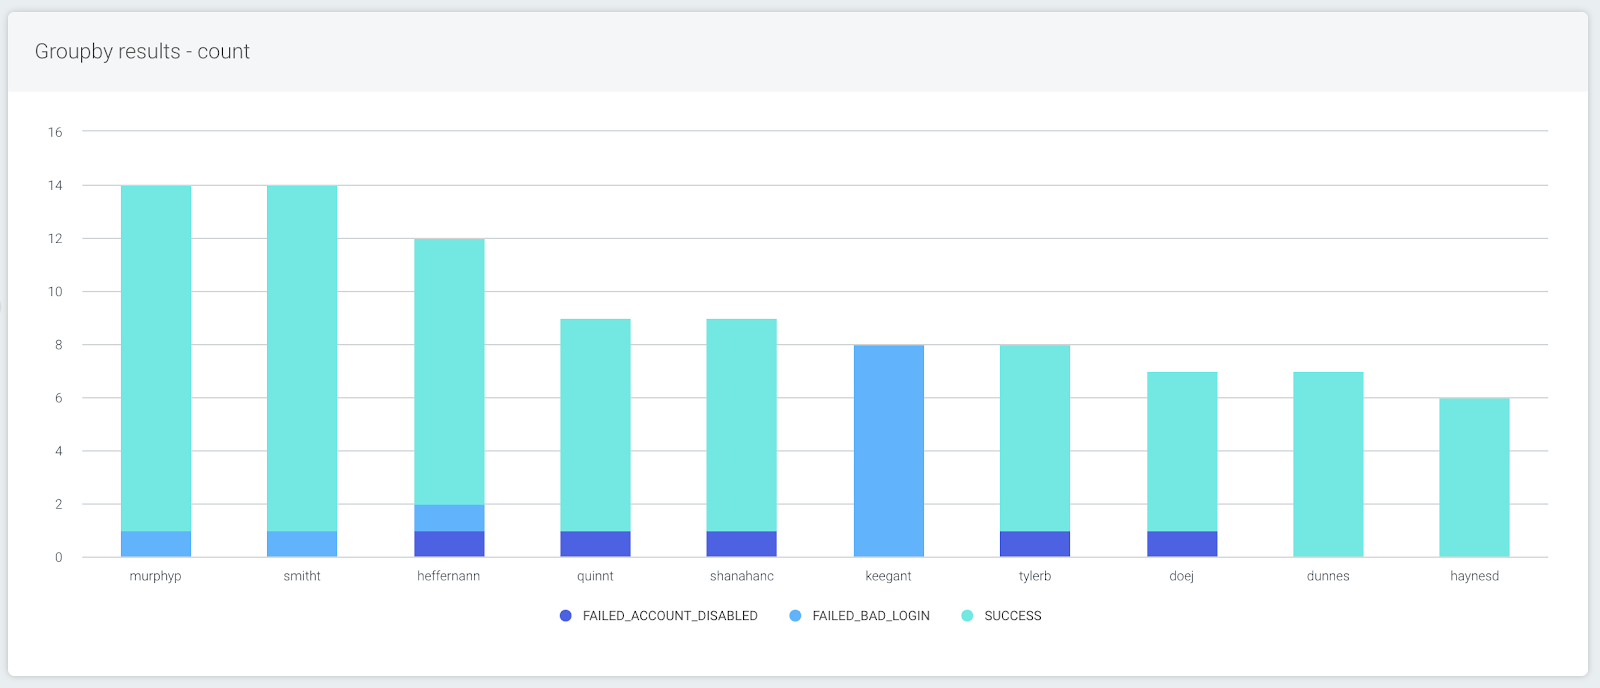
When this query is run, the data looks a bit different. The user with the highest number of attempts is still displaying first, but now as a stacked bar, with the second field (the result of the login attempt) appearing as data points within the user’s bar.
To explore the data, you can just click on one of the bars. In this example, it will filter by the user that was clicked, and the bars will show each login result, broken down by the service. You can continue to drill down until all the groups in your query are visible, or you can go back up a level by clicking the “back” button.
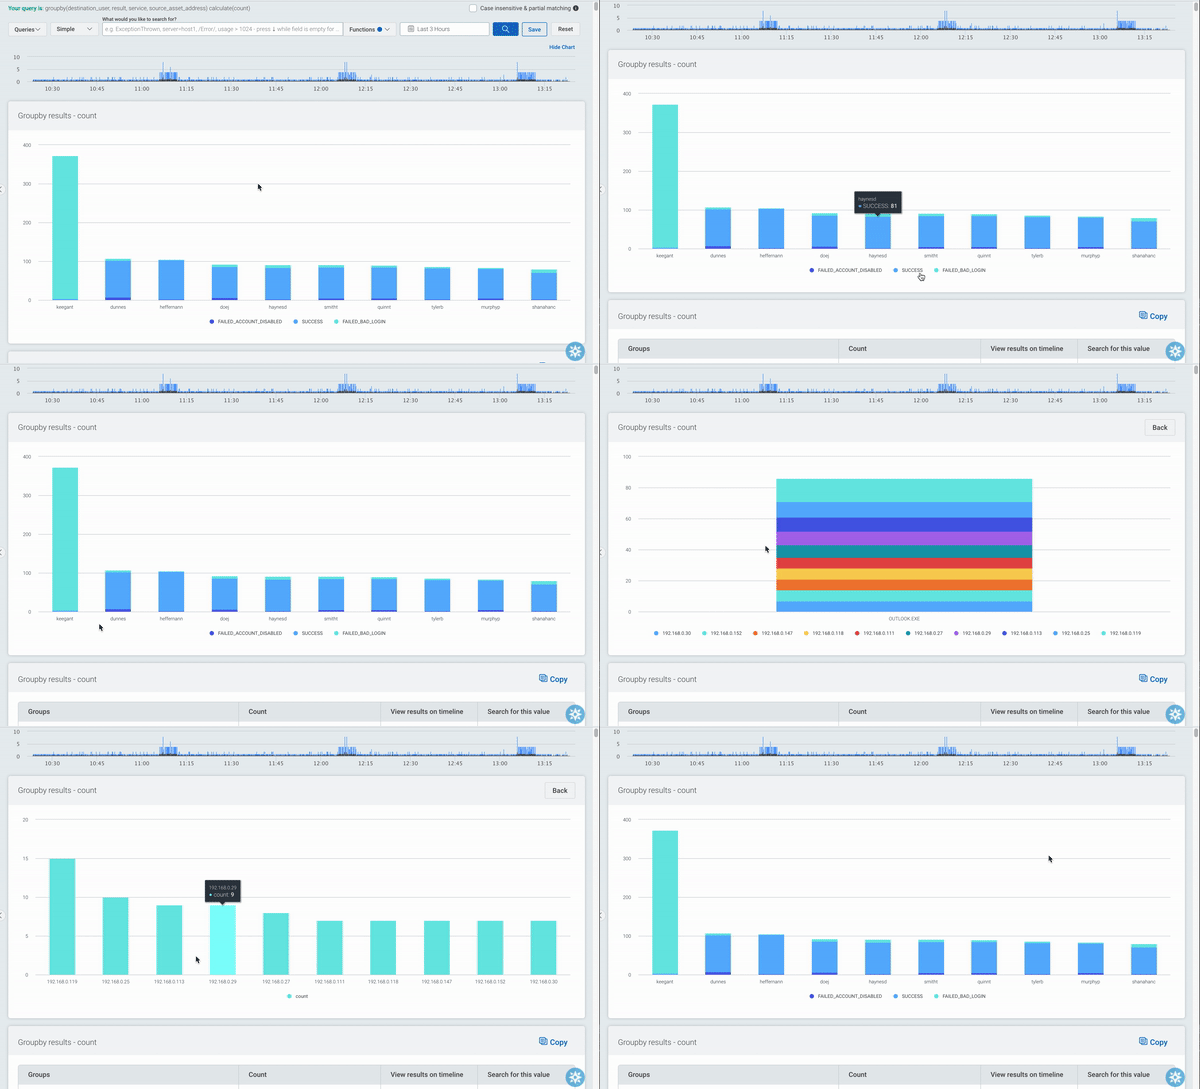
In the table beneath the chart, the first field’s values are displayed as before, now with options to explore the data in more detail.
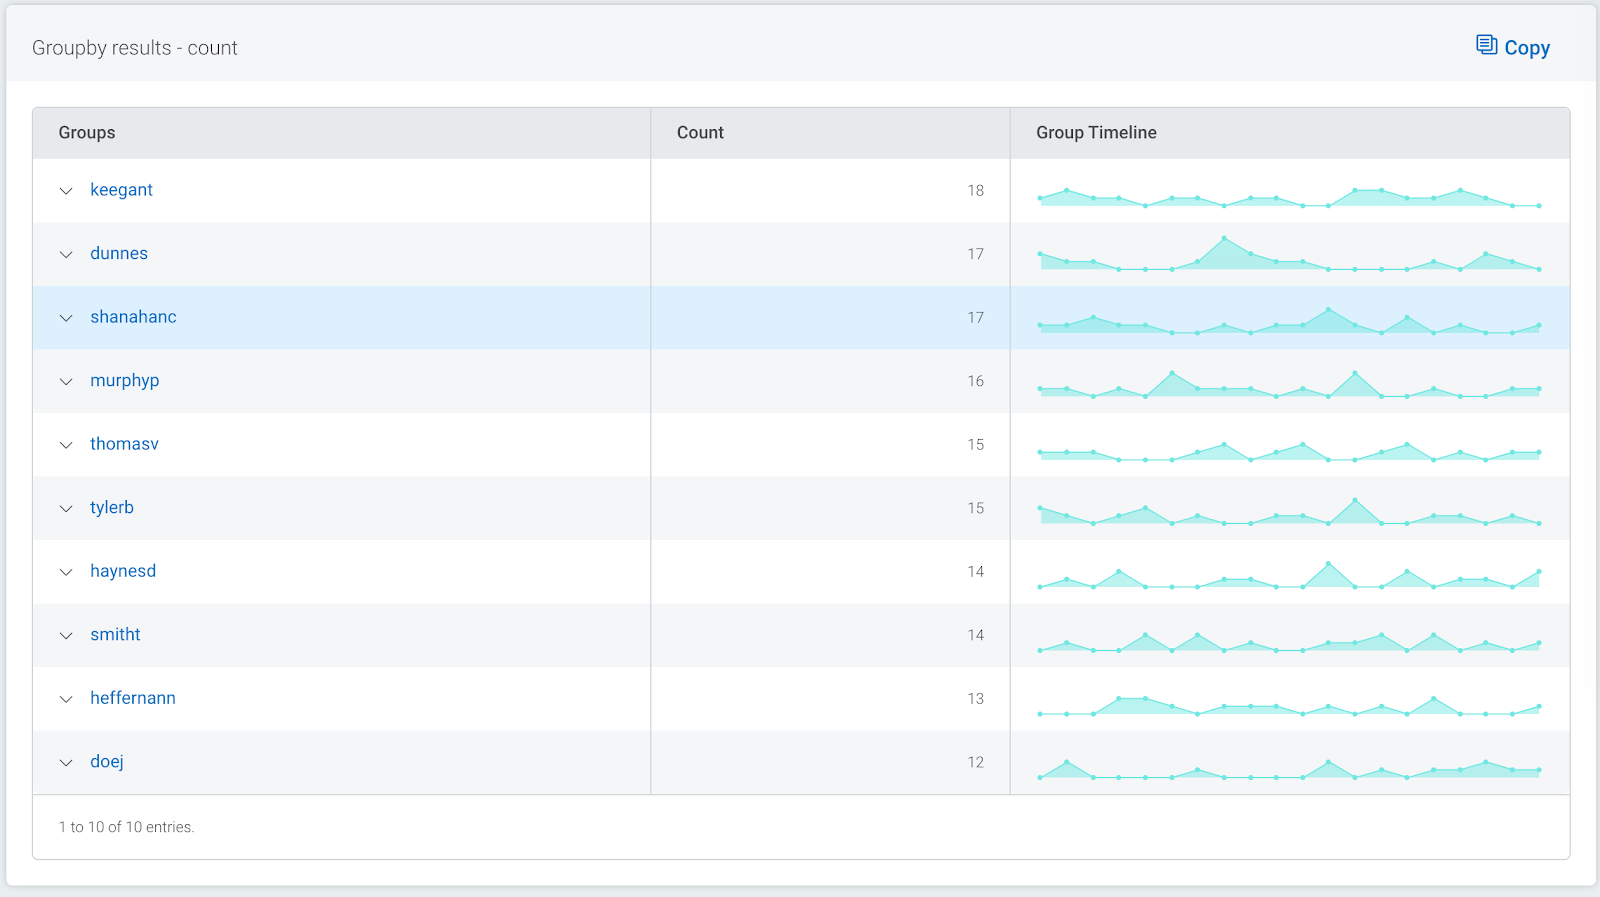
Using the arrows, additional rows displaying the subsequent fields’ values can be added to the table. As the data can be grouped by up to five levels, this provides a powerful way to narrow your search.
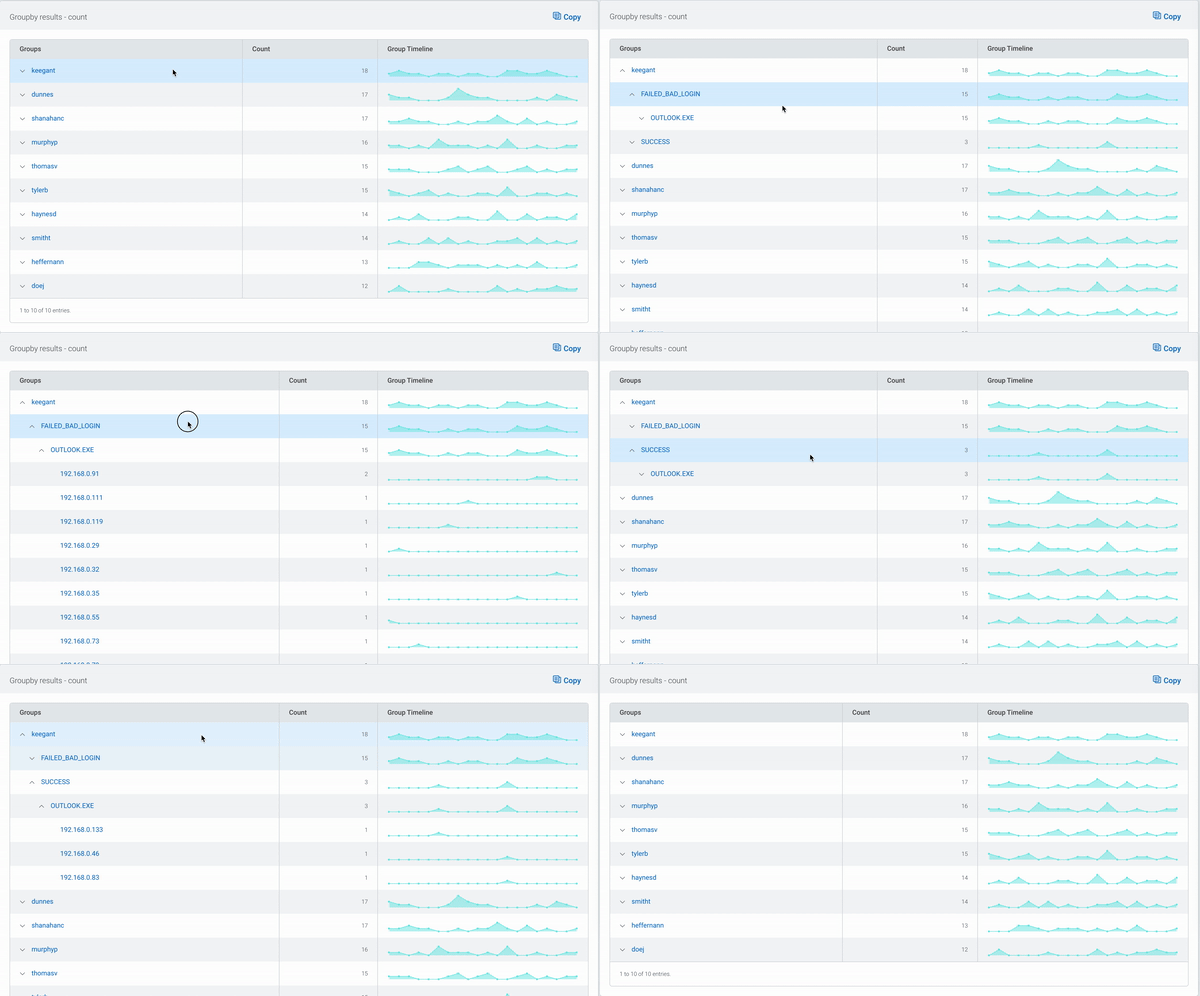
The links for each group allow you to quickly filter your log data by the combination of values, so you can get straight to the log data you’re looking for in seconds.
Tip: You can further refine your search by using the LIMIT and SORT options. The query below will continue to show the highest number of login attempts first, but the result and service will be sorted alphabetically. In addition, it will limit the number of groups returned.
groupby(destination_user, result, service, source_asset_address) calculate(count) sort(desc, asc#key, asc#key) limit(10,3,10)
Want to get more insight into your Network Traffic Analysis data? Here are some helpful queries to get you started
See what apps users are using to export data out of network:
where(direction="OUTBOUND") groupby(source_user, app_protocol_description) calculate(sum: "total_bytes")
See what countries and associated apps are connecting to network:
where(direction="INBOUND") groupby(geoip_country_name, app_protocol_description) calculate(sum: "total_bytes")
See DNS servers and associated DNS lookups:
groupby(top_private_domain, dns_server_address)
Summary
By adding additional fields to your log search queries, you can very quickly see a much richer picture of your log data, and from there, easily filter your data to get straight to the data you’re looking at—with no need to export your data to a BI tool, or run multiple queries.
NEVER MISS A BLOG
Get the latest stories, expertise, and news about security today.
Subscribe
If you like the site, please consider joining the telegram channel or supporting us on Patreon using the button below.


