Teler – Real-time HTTP Intrusion Detection

teler is an real-time intrusion detection and threat alert based on web log that runs in a terminal with resources that we collect and provide by the community.
Features
-
Real-time: Analyze logs and identify suspicious activity in real-time.
-
Alerting: teler provides alerting when a threat is detected, push notifications include Slack, Telegram and Discord.
-
Monitoring: We’ve our own metrics if you want to monitor threats easily, and we use Prometheus for that.
-
Latest resources: Collections is continuously up-to-date.
-
Minimal configuration: You can just run it against your log file, write the log format and let teler analyze the log and show you alerts!
-
Flexible log formats: teler allows any custom log format string! It all depends on how you write the log format in configuration file.
-
Incremental log processing: Need data persistence rather than buffer stream? teler has the ability to process logs incrementally through the on-disk persistence options.
Why teler?
teler was designed to be a fast, terminal-based threat analyzer. Its core idea is to quickly analyze and hunt threats in real time!
Installation
from Binary
The installation is easy. You can download a prebuilt binary from releases page, unpack and run! or run with:
▶ curl -sSfL 'https://ktbs.dev/get-teler.sh' | sh -s -- -b /usr/local/binusing Docker
Pull the Docker image by running:
▶ docker pull kitabisa/telerfrom Source
If you have go1.14+ compiler installed and configured:
▶ GO111MODULE=on go get -v -u ktbs.dev/teler/cmd/telerIn order to update the tool, you can use -u flag with go get command.
from GitHub
▶ git clone https://github.com/kitabisa/teler
▶ cd teler
▶ make build
▶ mv ./bin/teler /usr/local/bin
Usage
Simply, teler can be run with:
▶ [buffers] | teler -c /path/to/config/teler.yaml
# or
▶ teler -i /path/to/access.log -c /path/to/config/teler.yaml
If you’ve built teler with a Docker image:
▶ [buffers] | docker run -i --rm -e TELER_CONFIG=/path/to/config/teler.yaml teler
# or
▶ docker run -i --rm -e TELER_CONFIG=/path/to/config/teler.yaml teler --input /path/to/access.log
Flags
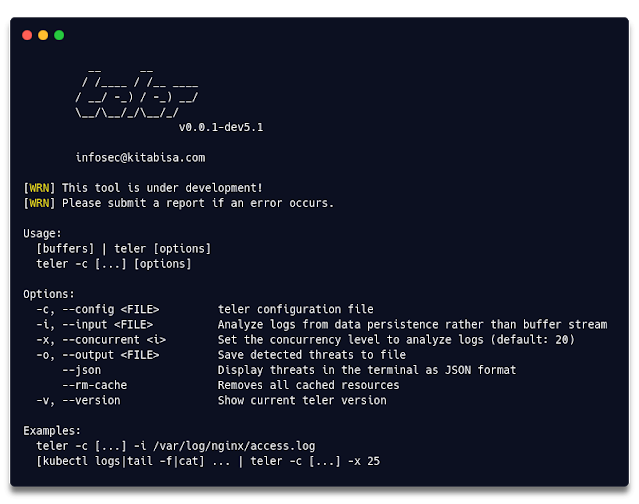
▶ teler -hThis will display help for the tool.


Here are all the switches it supports.
| Flag | Description | Examples |
|---|---|---|
| -c, –config |
teler configuration file | kubectl logs nginx | teler -c /path/to/config/teler.yaml |
| -i, –input |
Analyze logs from data persistence rather than buffer stream | teler -i /var/log/nginx/access.log |
| -x, –concurrent |
Set the concurrency level to analyze logs (default: 20) |
tail -f /var/log/nginx/access.log | teler -x 50 |
| -o, –output |
Save detected threats to file | teler -i /var/log/nginx/access.log -o /tmp/threats.log |
| –json | Display threats in the terminal as JSON format | teler -i /var/log/nginx/access.log –json |
| –rm-cache | Remove all cached resources | teler –rm-cache |
| -v, –version |
Show current teler version | teler -v |
Config
The -c flag is to specify teler configuration file.
▶ tail -f /var/log/nginx/access.log | teler -c /path/to/config/teler.yamlThis is required, but if you have defined TELER_CONFIG environment you don’t need to use this flag, e.g.:
▶ export TELER_CONFIG="/path/to/config/teler.yaml"
▶ tail -f /var/log/nginx/access.log | teler
# or
▶ tail -f /var/log/nginx/access.log | TELER_CONFIG="/path/to/config/teler.yaml" teler
Input
Need log analysis incrementally? This -i flag is useful for that.
▶ teler -i /var/log/nginx/access.logConcurrency
Concurrency is the number of logs analyzed at the same time. Default value teler provide is 20, you can change it by using -x flag.
▶ teler -i /var/log/nginx/access.log -x 50Output
You can also save the detected threats into a file with -o flag.
▶ teler -i /var/log/nginx/access.log -o threats.logJSON Format
If you want to display the detected threats as JSON format, switch it with --json flag.
▶ teler -i /var/log/nginx/access.log --jsonPlease note this will also apply if you save it to a file with -o flag.
Remove Caches
It will removes all stored resources in the user-level cache directory, see cache.
▶ teler --rm-cacheConfiguration
teler requires a minimum of configuration to process and/or log analysis, and execute threats and/or alerts. See teler.example.yaml for an example.
Log Formats
Because we use gonx package to parse the log, you can write any log format. As an example:
Apache
log_format: |
  $remote_addr - $remote_user [$time_local] "$request_method $request_uri $request_protocol" $status $body_bytes_sent
Nginx
log_format: |
  $remote_addr $remote_user - [$time_local] "$request_method $request_uri $request_protocol"
  $status $body_bytes_sent "$http_referer" "$http_user_agent"
Nginx Ingress
log_format: |
  $remote_addr - [$remote_addr] $remote_user - [$time_local]
  "$request_method $request_uri $request_protocol" $status $body_bytes_sent
  "$http_referer" "$http_user_agent" $request_length $request_time
  [$proxy_upstream_name] $upstream_addr $upstream_response_length $upstream_response_time $upstream_status $req_id
Amazon S3
log_format: |
  $bucket_owner $bucket [$time_local] $remote_addr $requester $req_id $operationration $key
  "$request_method $request_uri $request_protocol" $status $error_code $body_bytes_sent -
  $total_time - "$http_referer" "$http_user_agent" $version_id $host_id
  $signature_version $cipher_suite $http_auth_type $http_host_header $tls_version
Elastic LB
log_format: |
  $time_local $elb_name $remote_addr $upstream_addr $request_processing_time
  $upstream_processing_time $response_processing_time $status $upstream_status $body_received_bytes $body_bytes_sent
  "$request_method $request_uri $request_protocol" "$http_user_agent" $cipher_suite $tls_version
CloudFront
log_format: |
  $date $time $edge_location  $body_bytes_sent  $remote_addr
  $request_method $http_host_header $requst_uri $status
  $http_referer $http_user_agent  $request_query  $http_cookie  $edge_type  $req_id
  $http_host_header $ssl_protocol $body_bytes_sent  $response_processing_time $http_host_forwarded
  $tls_version  $cipher_suite $edge_result_type $request_protocol $fle_status $fle_encrypted_fields
  $http_port  $time_first_byte  $edge_detail_result_type
  $http_content_type  $request_length $request_length_start $request_length_end
Threat rules
Cache
By default, teler will fetch external resources every time you run it, but you can switch external resources to be cached or not.
rules:
  cache: true
If you choose to cache resources, it’s stored under user-level cache directory of cross-platform and will be updated every day, see resources.
Excludes
We include resources for predetermined threats, including:
- Common Web Attack
- Bad IP Address
- Bad Referrer
- Bad Crawler
- Directory Bruteforce
You can disable any type of threat in the excludes configuration (case-sensitive).
rules:
  threat:
    excludes:
      - "Bad IP Address"
The above format detects threats that are not included as bad IP address, and will not analyze logs/ send alerts for that type.
Whitelists
You can also add whitelists to teler configuration.
rules:
  threat:
    whitelists:
      - "(curl|Go-http-client|okhttp)/*"
      - "^/wp-login\.php"
It covers the entire HTTP request and processed as regExp, please write it with caution!
Notification
We provide alert notification options:
- Slack,
- Telegram
- Discord
Configure the notification alerts needed on:
notifications:
  slack:
    token: "xoxb-..."
    color: "#ffd21a"
    channel: "G30SPKI"

  telegram:
    token: "123456:ABC-DEF1234...-..."
    chat_id: "-111000"

  discord:
    token: "NkWkawkawkawkawka.X0xo.n-kmZwA8aWAA"
    color: "16312092"
    channel: "700000000000000..."
You can also choose to disable alerts or want to be sent where the alerts are.
alert:
  active: true
  provider: "slack"
Metrics
teler also supports metrics using Prometheus.
Prometheus
You can configure the host, port and endpoint to use Prometheus metrics in the configuration file.
prometheus:
  active: true
  host: "localhost"
  port: 9099
  endpoint: "/metrics"
Here are all the metrics we collected & categorized.
| Metric | Description |
|---|---|
teler_threats_count_total |
Total number of detected threats |
teler_cwa |
Get lists of Common Web Attacks |
teler_badcrawler |
Get lists of Bad Crawler requests |
teler_dir_bruteforce |
Get lists of Directories Bruteforced |
teler_bad_referrer |
Get lists of Bad Referrer requests |
teler_badip_count |
Total number of Bad IP Addresses |
Resources
All external resources used in this teler are NOT provided by us. See all peoples who involved in this resources at teler Resource Collections.
If you like the site, please consider joining the telegram channel or supporting us on Patreon using the button below.


![[HUNTERS] - Ransomware Victim: Ace Laboratories Limited 5 image](https://www.redpacketsecurity.com/wp-content/uploads/2024/09/image-300x300.png)
