Tracee – Container And System Event Tracing Using eBPF

Tracee is a lightweight and easy to use container and system tracing tool. It allows you to observe system calls and other system events in real-time. A unique feature of Tracee is that it will only trace newly created processes and containers (that were started after Tracee has started), in order to help the user focus on relevant events instead of every single thing that happens on the system (which can be overwhelming). Adding new events to Tracee (especially system calls) is straightforward, and will usually require no more than adding few lines of code.
Other than tracing, Tracee is also capable of capturing files written to disk or memory (“fileless”), and extracting binaries that are dynamically loaded to an application’s memory (e.g. when an application uses a packer). With these features, it is possible to quickly gain insights about the running processes that previously required the use of dynamic analysis tools and special knowledge.
Check out this quick demo of tracee
Getting started
Prerequisites
- To run, Tracee requires Linux kernel version >= 4.14
Not required if using the Docker image:
- C standard library (tested with glibc)
libelfandzliblibraries- clang >= 9
Not required if pre-compiling the eBPF code (see Installation options):
- clang >= 9
- Kernel headers available under
/usr/src, must be provided by user and match the running kernel version, not needed if building the eBPF program in advance
Quickstart with Docker
docker run --name tracee --rm --privileged --pid=host -v /lib/modules/:/lib/modules/:ro -v /usr/src:/usr/src:ro -v /tmp/tracee:/tmp/tracee aquasec/traceeNote: You may need to change the volume mounts for the kernel headers based on your setup.
This will run Tracee with no arguments, which defaults to collecting all events from all newly created processes and printing them in a table to standard output.
Setup options
Tracee is made of an executable that drives the eBPF program (tracee), and the eBPF program itself (tracee.bpf.$kernelversion.$traceeversion.o). When the tracee executable is started, it will look for the eBPF program next to the executable, or in /tmp/tracee, or in a directory specified in TRACEE_BPF_FILE environment variable. If the eBPF program is not found, the executable will attempt to build it automatically before it starts (you can control this using the --build-policy flag).
The easiest way to get started is to let the tracee executable build the eBPF program for you automatically. You can obtain the executable in any of the following ways:
- Download from the GitHub Releases (
tracee.tar.gz). - Use the docker image from Docker Hub:
aquasec/tracee(includes all the required dependencies). - Build the executable from source using
make build. For that you will need additional development tooling. - Build the executable from source in a Docker container which includes all development tooling, using
make build DOCKER=1.
Alternatively, you can pre-compile the eBPF program, and provide it to the tracee executable. There are some benefits to this approach since you will not need clang and kernel headers at runtime anymore, as well as reduced risk of invoking an external program at runtime. You can build the eBPF program in the following ways:
make bpfmake bpf DOCKER=1to build in a Docker container which includes all development tooling.- There is also a handy
make all(and themake all DOCKER=1variant) which builds both the executable and the eBPF program.
Once you have the eBPF program artifact, you can provide it to Tracee in any of the locations mentioned above. In this case, the full Docker image can be replaced by the lighter-weight aquasec/tracee:slim image. This image cannot build the eBPF program on its own, and is meant to be used when you have already compiled the eBPF program beforehand.
Running in container
Tracee uses a filesystem directory, by default /tmp/tracee to capture runtime artifacts, internal components, and other miscellaneous. When running in a container, it’s useful to mount this directory in, so that the artifacts are accessible after the container exits. For example, you can add this to the docker run command -v /tmp/tracee:/tmp/tracee.
If running in a container, regardless if it’s the full or slim image, it’s advisable to reuse the eBPF program across runs by mounting it from the host to the container. This way if the container builds the eBPF program it will be persisted on the host, and if the eBPF program already exists on the host, the container will automatically discover it. If you’ve already mounted the /tmp/tracee directory from the host, you’re good to go, since Tracee by default will use this location for the eBPF program. You can also mount the eBPF program file individually if it’s stored elsewhere (e.g in a shared volume), for example: -v /path/to/tracee.bpf.1_2_3.4_5_6.o:/some/path/tracee.bpf.1_2_3.4_5_6.o -e TRACEE_BPF_FILE=/some/path.
When using the --capture exec option, Tracee needs access to the host PID namespace. For Docker, add --pid=host to the run command.
If you are building the eBPF program in a container, you’ll need to make the kernel headers available in the container. The quickstart example has wide mounts that works in a variety of cases, for demonstration purposes. If you want, you can narrow those mounts down to a directory that contains the headers on your setup, for example: -v /path/to/headers:/myheaders -e KERN_SRC=/myheaders. As mentioned before, a better practice for production is to pre-compile the eBPF program, in which case the kernel headers are not needed at runtime.
Permissions
If Tracee is not actually tracing, it doesn’t need privileges. For example, just building the eBPF program, or listing the available options, can be done with a regular user.
For actually tracing, Tracee needs to run with sufficient capabilities:
CAP_SYS_RESOURCE(to manage eBPF maps limits)CAP_BPF+CAP_TRACINGwhich are available on recent kernels (>=5.8), orSYS_ADMINon older kernels (to load and attach the eBPF programs).
Alternatively, running as root or with the --privileged flag of Docker, is an easy way to start.
Using Tracee
Understanding the output
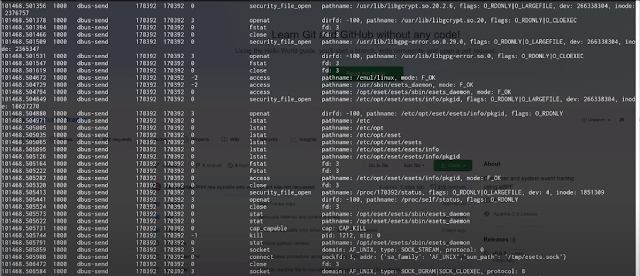
Here’s a sample output of running Tracee with no additional arguments (which defaults to tracing all events):
TIME(s)        UID    COMM             PID     TID     RET             EVENT                ARGS
176751.746515  1000   zsh              14726   14726   0               execve               pathname: /usr/bin/ls, argv: [ls]
176751.746772  1000   zsh              14726   14726   0               security_bprm_check  pathname: /usr/bin/ls, dev: 8388610, inode: 777
176751.747044  1000   ls               14726   14726  -2               access               pathname: /etc/ld.so.preload, mode: R_OK
176751.747077  1000   ls               14726   14726   0               security_file_open   pathname: /etc/ld.so.cache, flags: O_RDONLY|O_LARGEFILE, dev: 8388610, inode: 533737
...
Each line is a single event collected by Tracee, with the following information:
- TIME – shows the event time relative to system boot time in seconds
- UID – real user id (in host user namespace) of the calling process
- COMM – name of the calling process
- PID – pid of the calling process
- TID – tid of the calling thread
- RET – value returned by the function
- EVENT – identifies the event (e.g. syscall name)
- ARGS – list of arguments given to the function
When using table-verbose output, the following information is added:
- UTS_NAME – uts namespace name. As there is no container id object in the kernel, and docker/k8s will usually set this to the container id, we use this field to distinguish between containers.
- MNT_NS – mount namespace inode number.
- PID_NS – pid namespace inode number. In order to know if there are different containers in the same pid namespace (e.g. in a k8s pod), it is possible to check this value
- PPID – parent pid of the calling process
Configuration flags
- Use
--helpto see a full description of all options. Here are a few commonly useful flags: --traceSets the trace mode. For more information see Trace Mode Configuration below--eventallows you to specify a specific event to trace. You can use this flag multiple times, for example--event execve --event openat.--listlists the events available for tracing, which you can provide to the--eventflag.--outputlets you control the output format, for example--output jsonwill output as JSON lines instead of table.--capturecapture artifacts that were written, executed or found suspicious, and save them to the output directory. Possible values are: ‘write’/’exec’/’mem’/’all’
Trace Mode Configuration
--trace and -t set whether to trace events based upon system-wide processes, or Containers. It also used to set whether to trace only new processes/containers (default), existing processes/containers, or specific processes. Tracing specific containers is currently not possible. The possible options are:
| Option | Flag(s): |
|---|---|
| Trace new processes (default) | no --trace flag, --trace p, --trace process or --trace process:new |
| Trace existing and new processes | --trace process:all |
| Trace specific PIDs | --trace process:<pid>,<pid2>,... or --trace p:<pid>,<pid2>,... |
| Trace new containers | --trace c, --trace container or --trace container:new |
| Trace existing and new containers | --trace container:all |
You can also use -t e.g. -t p:all
Secure tracing
When Tracee reads information from user programs it is subject to a race condition where the user program might be able to change the arguments after Tracee has read them. For example, a program invoked execve("/bin/ls", NULL, 0), Tracee picked that up and will report that, then the program changed the first argument from /bin/ls to /bin/bash, and this is what the kernel will execute. To mitigate this, Tracee also provide “LSM” (Linux Security Module) based events, for example, the bprm_check event which can be reported by tracee and cross-referenced with the reported regular syscall event.
If you like the site, please consider joining the telegram channel or supporting us on Patreon using the button below.


