VolExp – Volatility Explorer

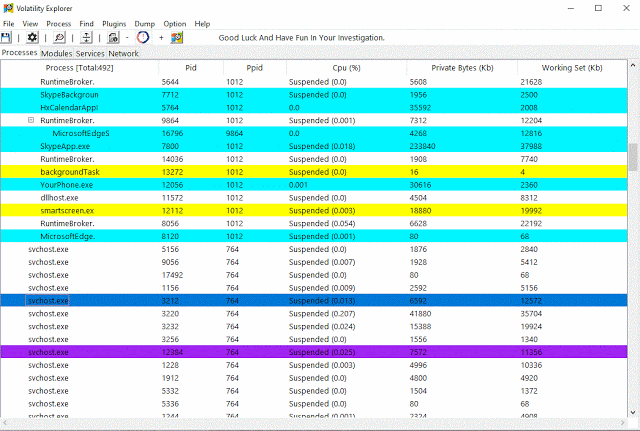
This program allows the user to access a Memory Dump. It can also function as a plugin to the Volatility Framework (https://github.com/volatilityfoundation/volatility). This program functions similarly to Process Explorer/Hacker, but additionally it allows the user access to a Memory Dump (or access the real-time memory on the computer using Memtriage). This program can run from Windows, Linux and MacOS machines, but can only use Windows memory images.
Quick Start
- Download the volexp.py file (download the memtriage.py file as well and replace it with your memtriage.py file if you want to use memtriage https://github.com/gleeda/memtriage).
- Run as a standalone program or as a plugin to Volatility:
- As a standalone program:
python2 volexp- As a Volatility plugin:
python2 vol.py -f <memory file path> --profile=<memory profile> volexpSome Features:
python2 memtriage.py --plugins=volexp- Some of the information display will not update in real time (except Processes info(update slowly), real time functions like struct analyzer, PE properties, run real time plugin, etc.).
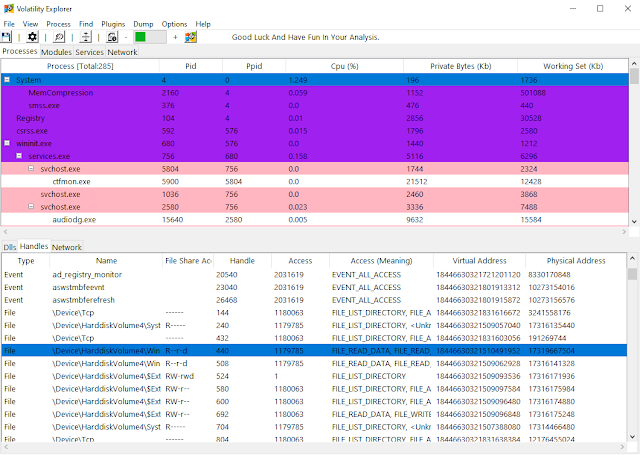
- The program also allows to view Loaded dll’s, open handles and network connections of each process (Access to a dll’s properties is also optional).
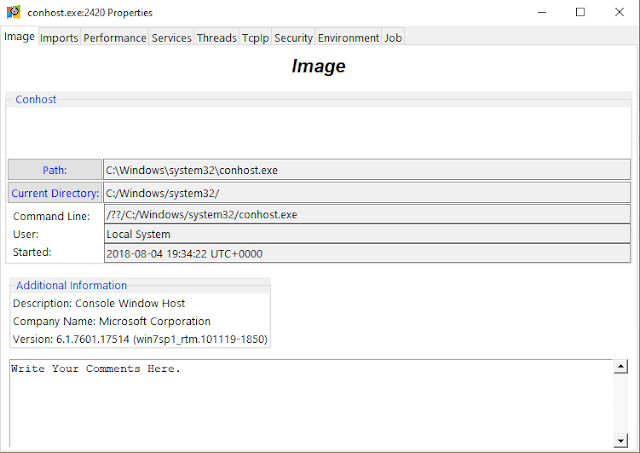
- To present more information of a process, Double-Click (or Left-Click and select Properties) to bring up an information window.
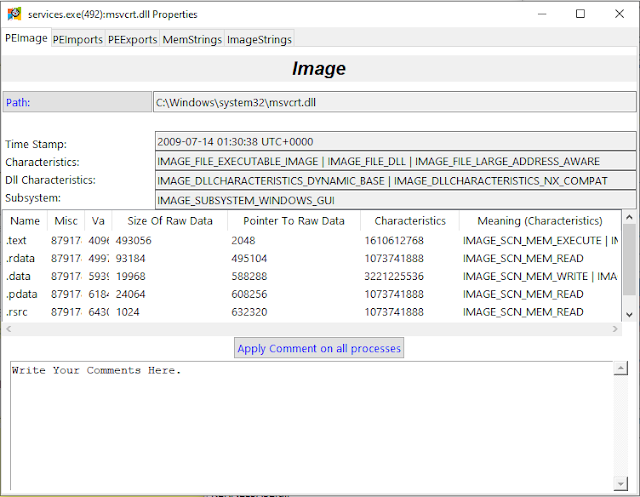
- Or present more information on any PE.
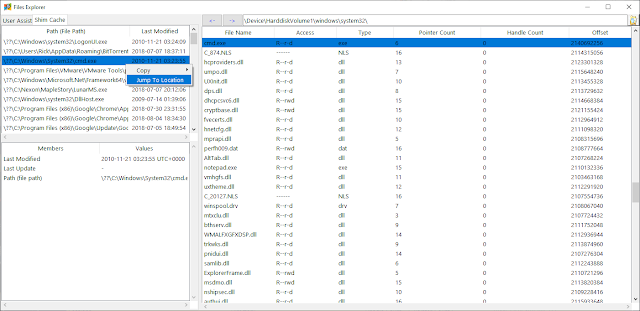
- The program allows the user to view the files in the Memory Dump as well as their information. Additionally, it allows the user to extract those files (HexDump/strings view is also optional).
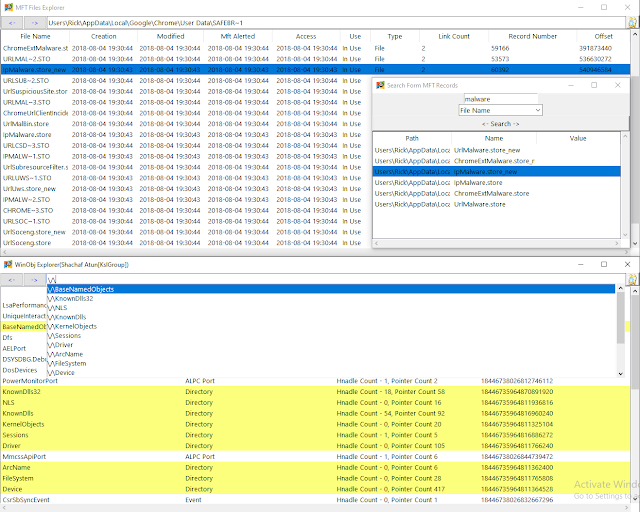
- The program supports viewing of the Windows Objects and files’s matadata (MFT).
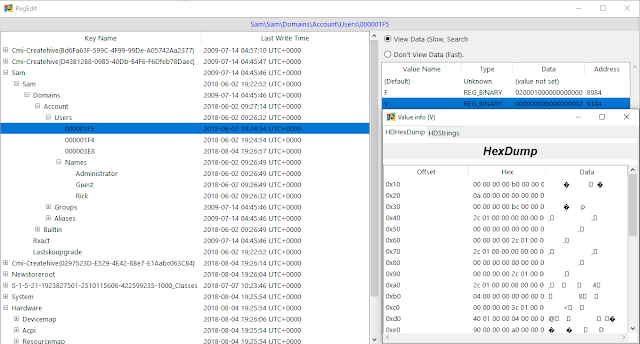
- The program also support viewing a regview of the memory dump
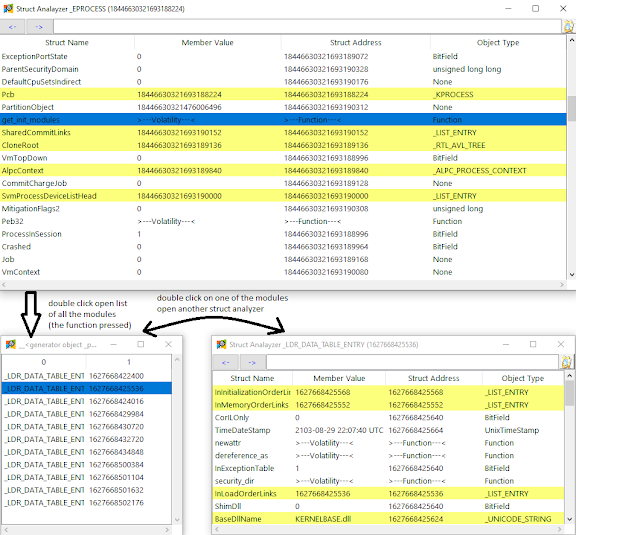
- Additionally, the program supports struct analysis. (writing on the memory’s struct, running Volatility functions on a struct is available). Example of getting all the load modules inside _EPROCESS struct in another struct analyzer window:
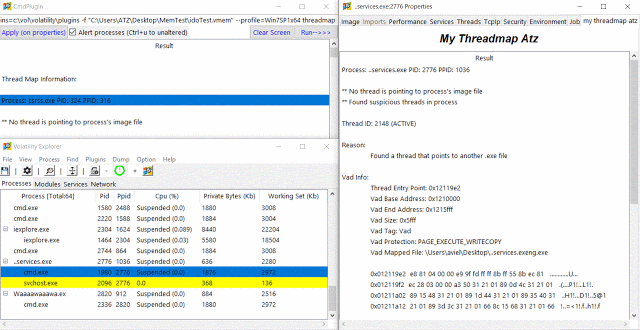
- The Program is also capable of automatically marking suspicious processes found by another plugin. Example of a running threadmap plugin:
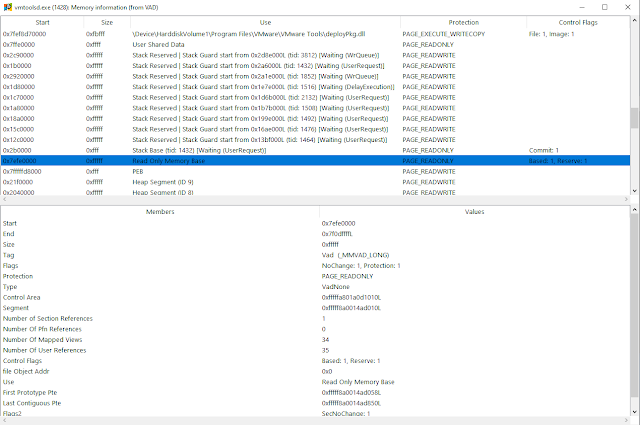
- View memory use of a process.
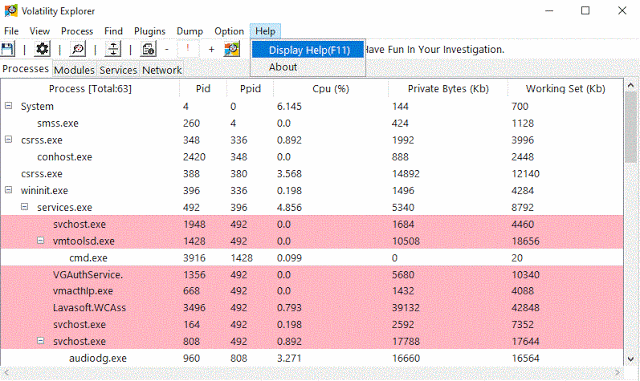
- Manually marking a certain process and adding a sidenote on it.
- User’s actions can be saved on a seperate file for later usage.
get help: https://github.com/memoryforensics1/VolExp/wiki/VolExp-help:
Download VolExp
If you like the site, please consider joining the telegram channel or supporting us on Patreon using the button below.


