Voltron – A Hacky Debugger UI For Hackers

Voltron is an extensible debugger UI toolkit written in Python. It aims to improve the user experience of various debuggers (LLDB, GDB, VDB and WinDbg) by enabling the attachment of utility views that can retrieve and display data from the debugger host. By running these views in other TTYs, you can build a customised debugger user interface to suit your needs.
Voltron does not aim to be everything to everyone. It’s not a wholesale replacement for your debugger’s CLI. Rather, it aims to complement your existing setup and allow you to extend your CLI debugger as much or as little as you like. If you just want a view of the register contents in a window alongside your debugger, you can do that. If you want to go all out and have something that looks more like OllyDbg, you can do that too.
Built-in views are provided for:
- Registers
- Disassembly
- Stack
- Memory
- Breakpoints
- Backtrace
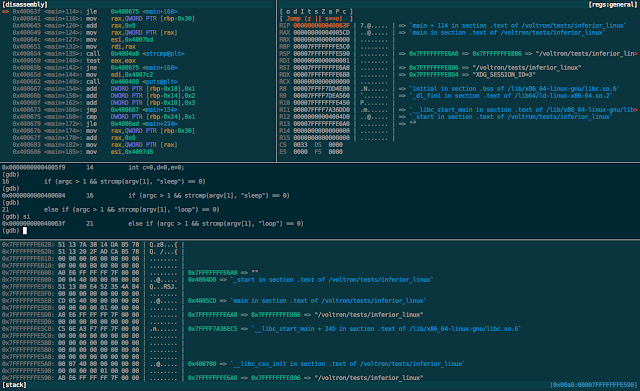
The author’s setup looks something like this:

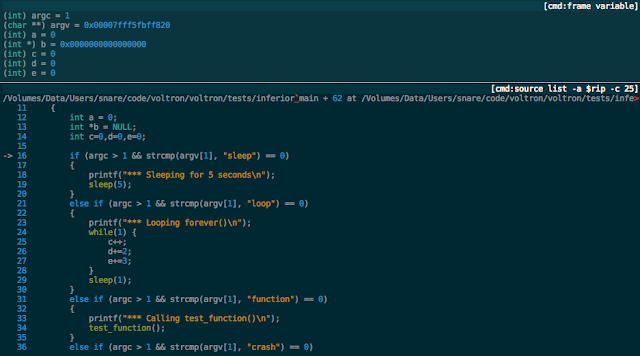
Any debugger command can be split off into a view and highlighted with a specified Pygments lexer:

More screenshots are here.
Support
Voltron supports LLDB, GDB, VDB and WinDbg/CDB (via PyKD) and runs on macOS, Linux and Windows.
WinDbg support is still fairly new, please open an issue if you have problems.
The following architectures are supported:
| lldb | gdb | vdb | windbg | |
|---|---|---|---|---|
| x86 | ✓ | ✓ | ✓ | ✓ |
| x86_64 | ✓ | ✓ | ✓ | ✓ |
| arm | ✓ | ✓ | ✓ | ✗ |
| arm64 | ✓ | ✗ | ✗ | ✗ |
| powerpc | ✗ | ✓ | ✗ | ✗ |
Installation
Note: Only macOS and Debian derivatives are fully supported by the install script. It should hopefully not fail on other Linux distros, but it won’t try to install package dependencies. If you’re using another distro, have a look at install.sh to work out what dependencies you might need to install before running it.
Download the source and run the install script:
$ git clone https://github.com/snare/voltron
$ cd voltron
$ ./install.sh
By default, the install script will install into the user’s site-packages directory. If you want to install into the system site-packages, use the -s flag:
$ ./install.sh -s
You can also install into a virtual environment (for LLDB only) like this:
$ ./install.sh -v /path/to/venv -b lldb
If you are on Windows without a shell, have problems installing, or would prefer to install manually, please see the manual installation documentation.
Quick Start
-
If your debugger has an init script (
.lldbinitfor LLDB or.gdbinitfor GDB) configure it to load Voltron when it starts by sourcing theentry.pyentry point script. The full path will be inside thevoltronpackage. For example, on macOS it might be /Library/Python/2.7/site-packages/voltron/entry.py. Theinstall.shscript will add this to your.gdbinitor.lldbinitfile automatically if it detects GDB or LLDB in your path.LLDB:
command script import /path/to/voltron/entry.pyGDB:
source /path/to/voltron/entry.py -
Start your debugger and initialise Voltron manually if necessary.
On recent versions of LLDB you do not need to initialise Voltron manually:
$ lldb target_binaryOn older versions of LLDB you need to call
voltron initafter you load the inferior:$ lldb target_binary
(lldb) voltron initGDB:
$ gdb target_binaryVDB:
 $ ./vdbbin target_binary
 > script /path/to/voltron/entry.py
WinDbg/CDB is only supported run via Bash with a Linux userland. The author tests with Git Bash and ConEmu. PyKD and Voltron can be loaded in one command when launching the debugger:
$ cdb -c '.load C:pathtopykd.pyd ; !py --global C:pathtovoltronentry.py' target_binary -
In another terminal (I use iTerm panes) start one of the UI views. On LLDB, WinDbg and GDB the views will update immediately. On VDB they will not update until the inferior stops (at a breakpoint, after a step, etc):
 $ voltron view register
 $ voltron view stack
 $ voltron view disasm
$ voltron view backtrace -
Set a breakpoint and run your inferior.
 (*db) b main
(*db) run -
When the debugger hits the breakpoint, the views will be updated to reflect the current state of registers, stack, memory, etc. Views are updated after each command is executed in the debugger CLI, using the debugger’s “stop hook” mechanism. So each time you step, or continue and hit a breakpoint, the views will update.
Documentation
See the wiki on github.
FAQ
Q. Why am I getting an ImportError loading Voltron?
A. You might have multiple versions of Python installed and have installed Voltron using the wrong one. See the more detailed installation instructions.
Q. GEF? PEDA? PwnDbg? fG’s gdbinit?
A. All super great extensions for GDB. These tools primarily provide sets of additional commands for exploitation tasks, but each also provides a “context” display with a view of registers, stack, code, etc, like Voltron. These tools print their context display in the debugger console each time the debugger stops. Voltron takes a different approach by embedding an RPC server implant in the debugger and enabling the attachment of views from other terminals (or even web browsers, or now synchronising with Binary Ninja), which allows the user to build a cleaner multi-window interface to their debugger. Voltron works great alongside all of these tools. You can just disable the context display in your GDB extension of choice and hook up some Vo ltron views, while still getting all the benefits of the useful commands added by these tools.
Bugs and Errata
See the issue tracker on github for more information or to submit issues.
If you’re experiencing an ImportError loading Voltron, please ensure you’ve followed the installation instructions for your platform.
LLDB
On older versions of LLDB, the voltron init command must be run manually after loading the debug target, as a target must be loaded before Voltron’s hooks can be installed. Voltron will attempt to automatically register its event handler, and it will inform the user if voltron init is required.
WinDbg
More information about WinDbg/CDB support here.
Misc
The authors primarily use Voltron with the most recent version of LLDB on macOS. We will try to test everything on as many platforms and architectures as possible before releases, but LLDB/macOS/x64 is going to be by far the most frequently-used combination. Hopefully Voltron doesn’t set your pets on fire, but YMMV.
License
See the LICENSE file.
If you use this and don’t hate it, buy me a beer at a conference some time. This license also extends to other contributors – richo definitely deserves a few beers for his contributions.
Credits
Thanks to my former employers Assurance and Azimuth Security for giving me time to spend working on this.
Props to richo for all his contributions to Voltron.
fG!’s gdbinit was the original inspiration for this project.
Thanks to Willi for implementing the VDB support.
Voltron now uses Capstone for disassembly as well as the debugger hosts’ internal disassembly mechanism. Capstone is a powerful, open source, multi-architecture disassembler upon which the next generation of reverse engineering and debugging tools are being built. Check it out.
Thanks to grazfather for ongoing contributions.
If you like the site, please consider joining the telegram channel or supporting us on Patreon using the button below.


